infrastructure

Interactive map and infographics support EV charging accessibility and preparation in North Carolina

How can you tell whether a road is safe after a flood?

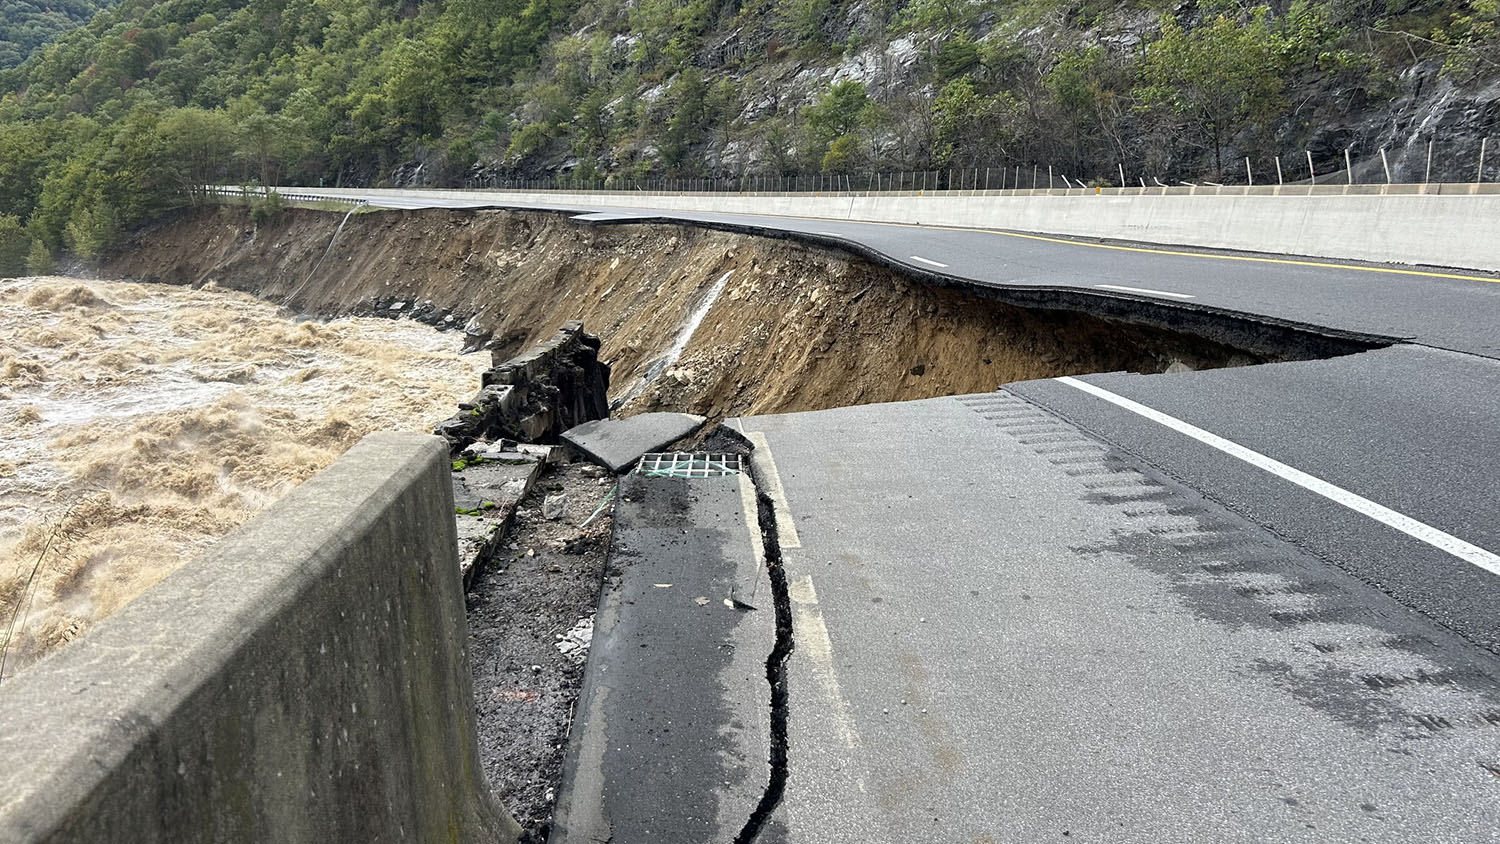
How has flooding from Helene affected transportation in western NC?
